Workflow automation could give back four and a half months of employees’ time by liberating them from manual, repetitive tasks, which could instead be used for more meaningful and rewarding work.
That’s according to a global study by Automation Anywhere, which surveyed more than 10,000 workers across a range of industries.
The survey also revealed that staff would be able to undertake their primary job more efficiently, learn new skills, and improve productivity in their department if they were freed from repetitive work. Even 88% anticipated they’d be happier at work if automation eliminated their manual tasks.
Workflow automation sure sounds like a silver bullet to a higher performing workforce, but what is it exactly? And what are the key benefits of workflow automation? Here’s what you need to know:

What is workflow automation?
In a nutshell, workflow automation is a piece of digital workplace tech that uses rule-based logic to automatically schedule and run repetitive tasks in the background, with minimal to no human input.
It ultimately replaces manual tasks with an automated process that runs in real time.

Workflow automation software allows businesses to build workflows based on their existing processes, such as purchasing IT equipment, claiming expenses, and emailing human resources with leave requests. Once the workflows are set up, teams can focus on more rewarding work whilst the background logic does the heavy lifting.
What are the benefits of workflow automation?
Workflow automation software helps you save time from manual tasks
According to a poll of over 2,000 UK workers, staff spend almost five hours a week on manual admin and paperwork. This is time that could undoubtedly be better spent elsewhere.
The “digital admin” you spend hours doing every day — like data entry, sending emails, and completing paperwork — can easily be automated with workflow management tools, saving you precious time to focus on more meaningful pursuits.
Every manual task has its own process map — which defines who in the business is responsible for what and when — that can be used as the basis for an automated workflow.

For example, you can create a workflow that automatically sends an expense claim to a particular team member in the finance department. This notifies the claimant once it’s processed, and then closes the claim after a predefined number of days. Automating each of these steps is a one-off task, and will save hours of manual work over time.
Workflow automation replaces paper-based business processes
By using workflow automation software, you can replace anything that involves physical paperwork with interactive online forms. Think CV screenings, home office equipment requests, employee engagement questionnaires, and feedback surveys. You name it, you can digitise it!
Leveraging workflow automation, you can add smart business rules to your online forms that automatically fill in certain fields based on existing data, saving your staff time from inputting info that the software already has. For example, fields such as name, email address, and job title can be pulled out from your employee intranet portal and automatically added into your online forms.
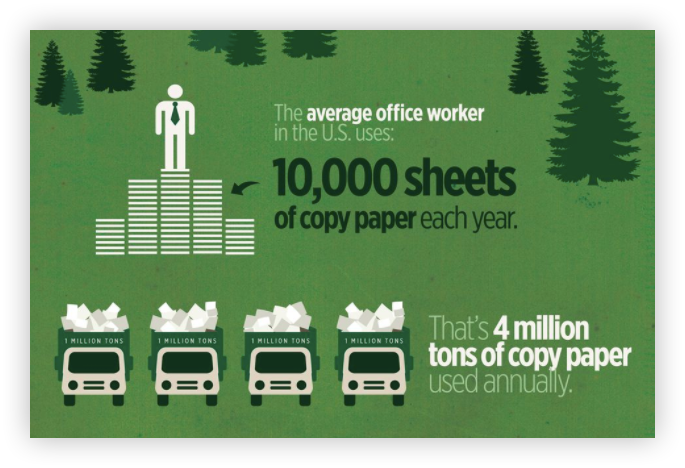
The benefits of going paperless reach beyond saving staff from the mundane. According to data by the EPA, the average US office worker uses 10,000 sheets of copy paper a year, equating to 4 million tons of annual paper consumption. This is a staggeringly high figure that shows the negative impact paperwork has on the environment.
Workflow automation tools reduce human error and improves efficiency
Even with the best of intentions, if you’re doing the same task a hundred times over you’re bound to make a mistake at some point. Manually entering data into a spreadsheet or physically ticking boxes on reams of paper forms will — let’s face it — lead to multiple errors.
Workflow automation takes care of this repetitive task management for you, reducing human error and improving accuracy. For instance, the software will flag up any missing data from an online form and prevent you from submitting it until you’ve completed all the fields.
Your teams will also become more efficient. Workflow automation tools can automatically update the status of a form based on how much time has passed since it was submitted or if a certain action has taken place. And if a form hasn’t been processed within a predefined time frame, then the system will automatically ping a reminder to the relevant team member.
A short summary of workflow automation
The demand for less repetitive work is present; staff are eager to utilise their skills and experience for meaningful work that makes a real difference to their organisation, if only those manual tasks weren’t standing in their way.
Workflow automation dramatically reduces the burden of repetitive and monotonous tasks. It saves employees hours of valuable time, improves accuracy and efficiency, and helps reduce the environmental impact of paperwork.