Capture insights with powerful intranet analytics
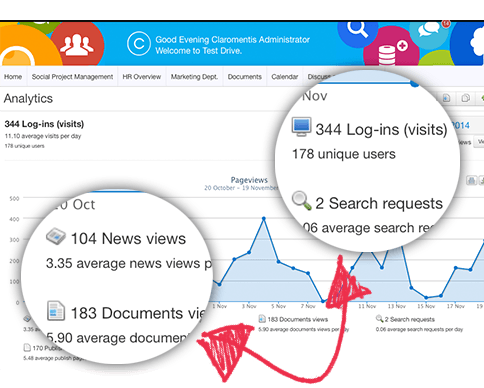
This intranet app ensures that intranet user trends and statistics are readily available, easy to understand and can be effectively interpreted. Data is represented in graphical, statistical and numerical format, and can be compared to previous time periods to monitor intranet traffic and user behaviour. This will ultimately aid intranet administrators in fulfilling their objective of providing employees regardless of department, role or location with an online workspace that will enable them to do their job more efficiently.
Book a demoUnderstand user trends
If employees cannot find or access information specific information relevant to them, they simply will not view their intranet as a valuable resource; this will inevitably result in a reduction in the number of employees using it. To prevent this from happening, we have developed a feature which measures data associated the intranet search functionality.
Visual data
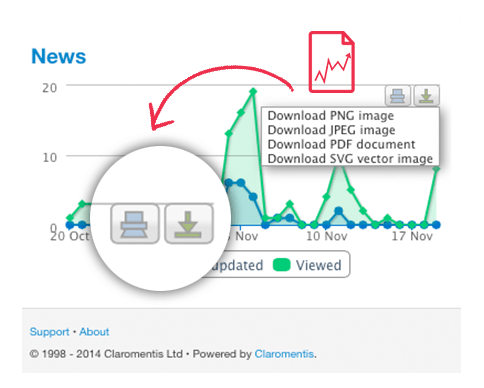
The intuitive design and clear layout enables users to access a range of data associated with different areas of the intranet in a rapid manner. If further analysis is required the graphs can be downloaded either as a JPEG, PNG, PDF or a SVG file and printed. This eliminates the need for lengthy reports, which in turn reduces the amount of time and resources spent on collecting and analysing non-statistical data.
Interpret insights
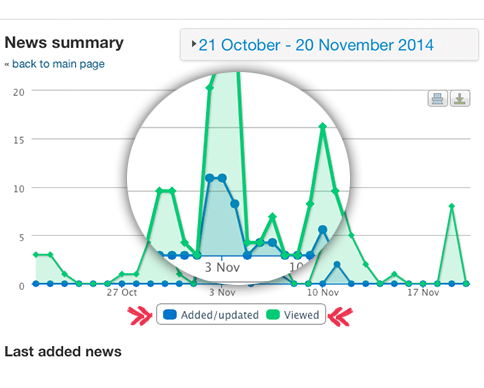
The presentation of data in graph form allows for immediate comparisons to be made, it also provides new insights into the capabilities of your intranet resulting in successful forecasting for the future. Areas of the intranet which are outdated or inadequate can be easily identified through the low percentage of users reading published pages, news reviews and documents.